This is a perfect week to begin a home phenology monitoring project.
Phenology is the study of periodic plant and animal life cycle events and how these are influenced by seasonal and interannual variations in climate, as well as habitat factors (such as elevation).
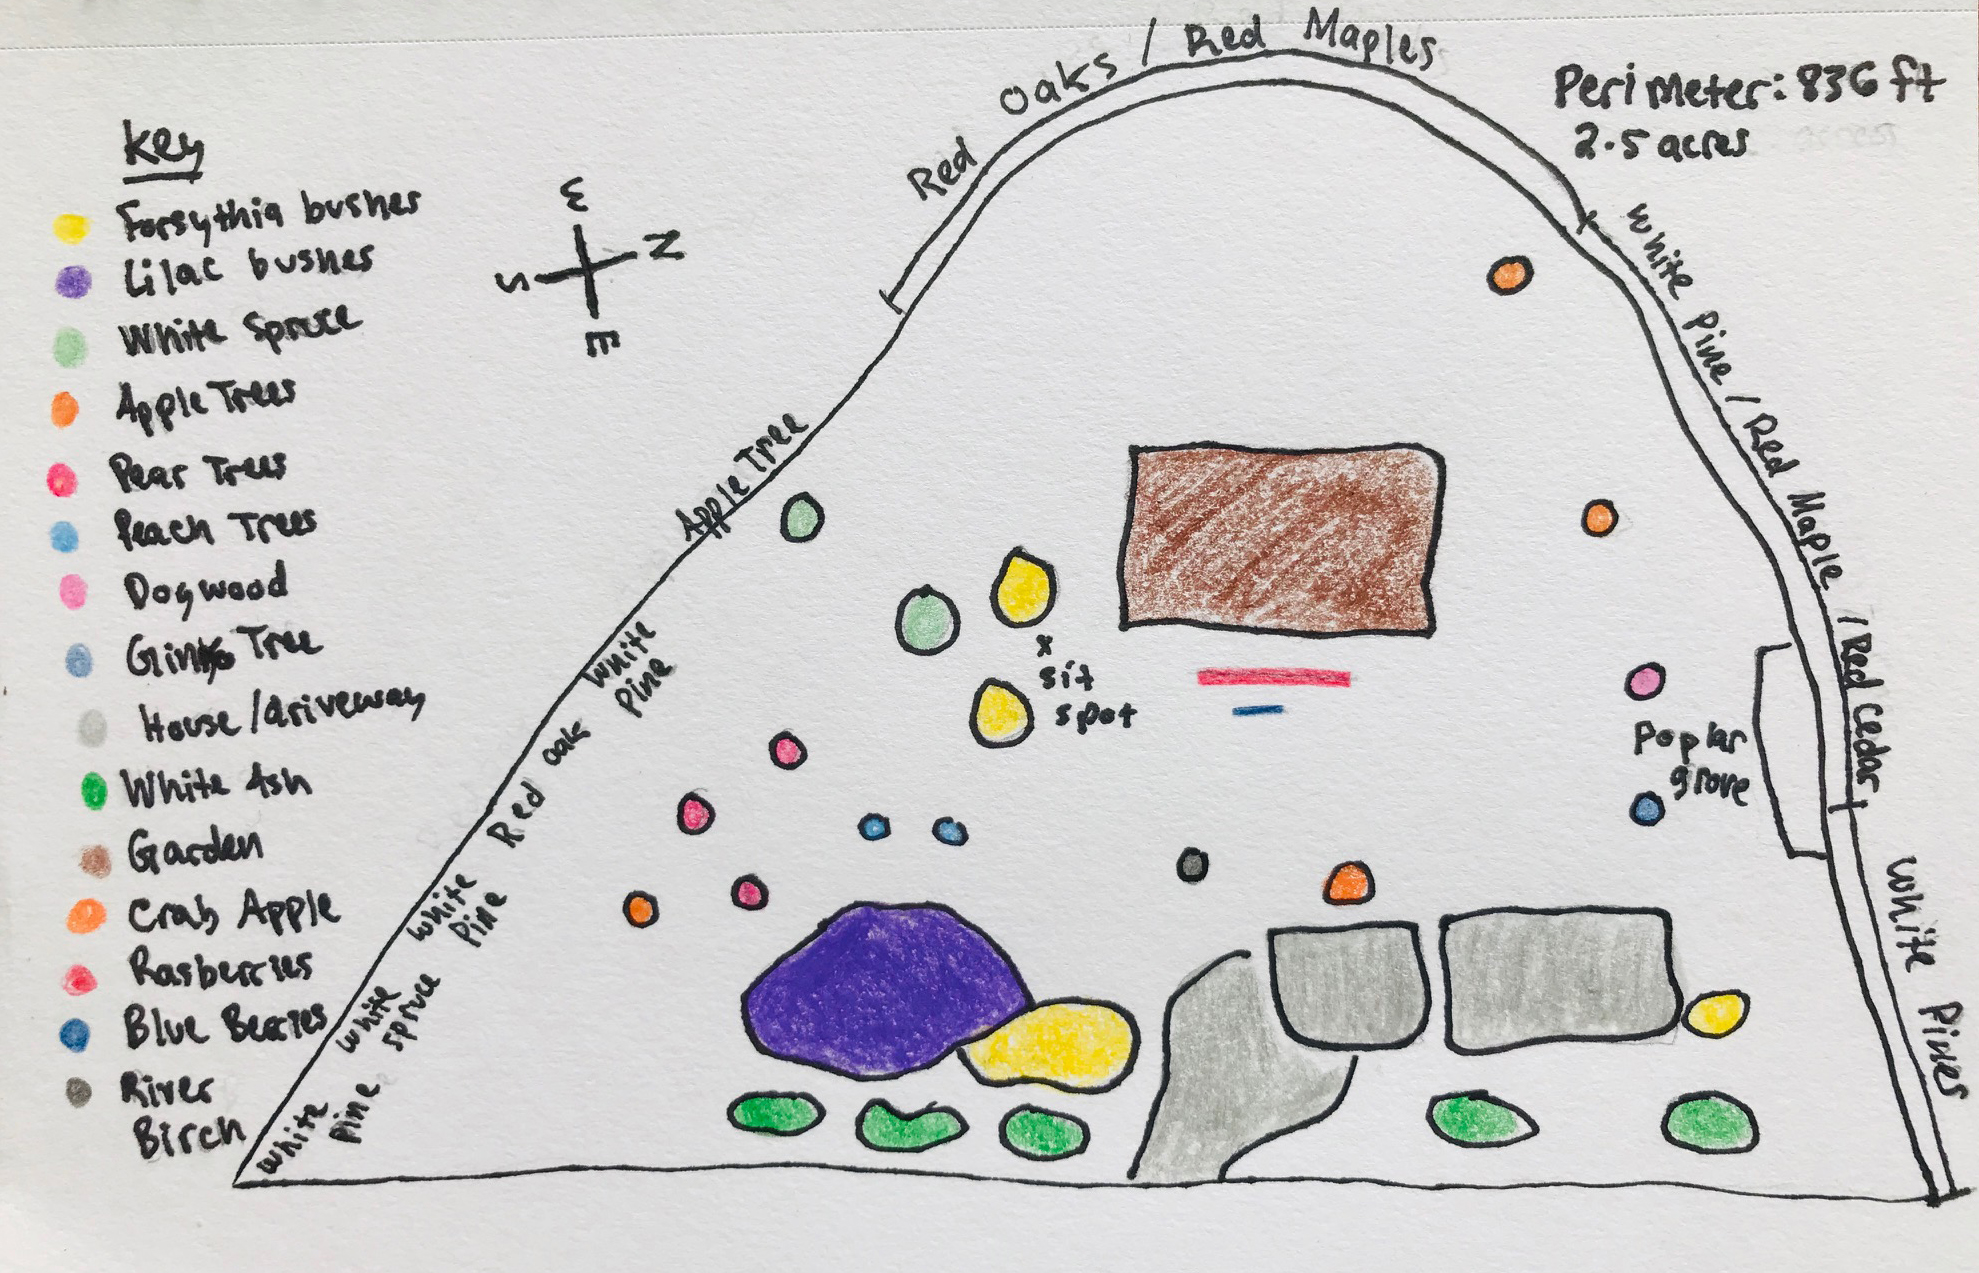
To begin, create a map of your ‘home phenology monitoring area’- pace the perimeter of the spot you select, calculate the area, and take an inventory of the trees and flowering shrubs in your spot so that we can start to hone in on which ones will begin leafing out soon. If you live in an apartment or urban area without access to outdoor space, consider adapting this project to a window box or indoor plants.
Here’s an example of a phenology map:
You can use these two worksheets to help with your monitoring project:
- Phenology Map and Species Inventory
- Leaf Out Dates Highlighting a Changing Climate Reading Questions
We are using the Arbor Day Foundation Tree ID Guide to help identify trees if you don’t have a tree guide at your house.
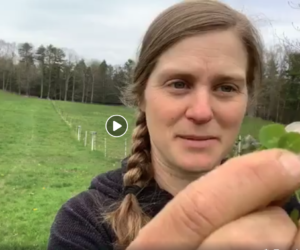
We can also look at the U.S. National Phenology Network Maps of Leaf Out and First Bloom to track spring leaf out and spring bloom within the U.S. and to see how this spring compares to recent decades. These maps are interactive, up to date and really neat to check out. We can also watch this Short video about Spring’s Early Arrival with USA-NPN’s Associate Director Theresa Crimmins:
Another good source is this super interesting article Leaf-out Dates Highlight a Changing Climate and then fill out these Reading Questions and ‘Species Watch List’ to get a better sense of the what, why, and how of leaf out, and to begin making predictions about which local trees to start paying attention to at your home for first leaf out.
We love to see the home phenology maps you make – please share them back with us and we’ll add them to this page!